
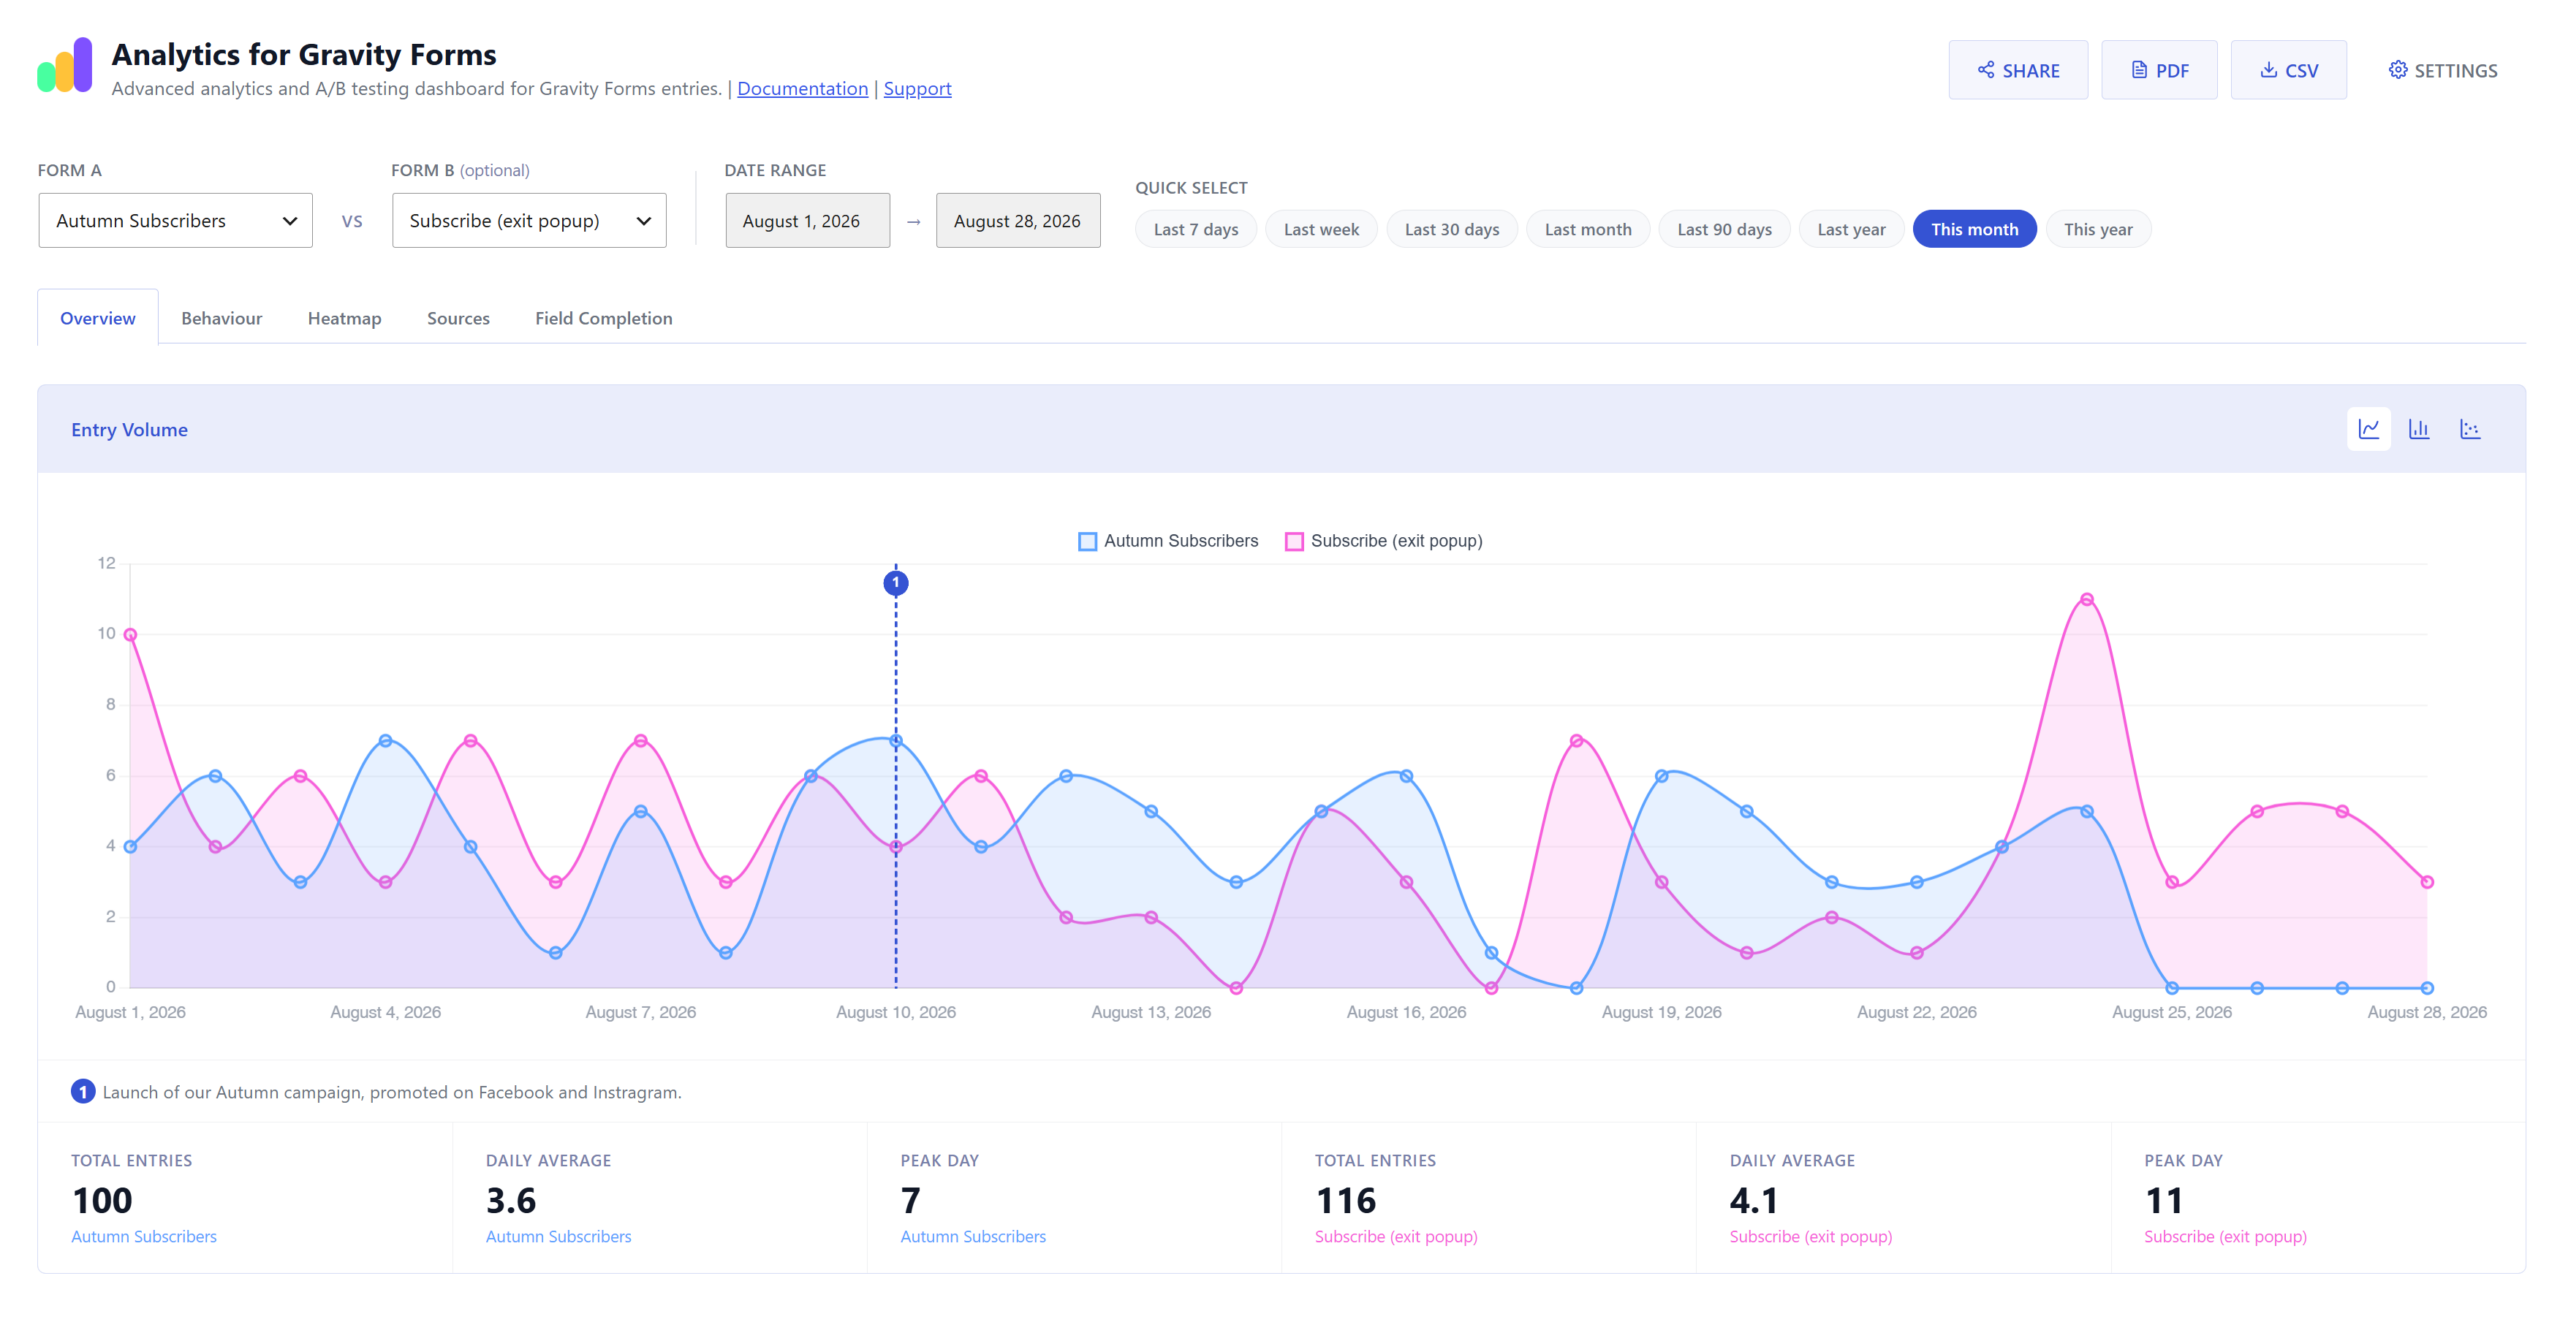
Analytics for Gravity Forms turns your Gravity Forms submission data into a visual analytics dashboard.
Instead of manually counting entries or wrestling with Gravity Forms’ sub-par spreadsheet exports like a caveman, get a clear view of your form performance at a glance.
See charts, trends and useful insights into how people interact with your forms. Track a single form or compare two forms side by side (perfect for A/B testing), track where visitors drop off before submitting, discover which pages generate the most conversions, schedule email reports, and share live dashboards with clients.
And when you need to export your data, you can generate PDF and CSV reports that are actually useful.
Features
– Analytics dashboard showing daily entry counts for one or two Gravity Forms simultaneously
– Spam submission tracking displayed alongside legitimate entries on the same chart
– Date range filtering with quick-select pre-sets
– Chart annotations: display information about significant dates in charts
– Behaviour analytics: form views, average completion time, and field-level drop-off rates
– Submission heatmap showing entry volume by day of week and hour
– Source URL tracking using Gravity Forms’ native entry data, showing which pages forms were submitted from
– Field completion rates showing the percentage of sessions that filled each field
– Shareable report links: generate public URLs for read-only HTML reports (optionally have them password protected)
– Scheduled digest emails summarising entry counts across all forms (daily, weekly, or monthly)
– Alert emails when a form experiences a submission spike or drop beyond a configurable threshold, or goes a number of days without submissions
– Export data to CSV
– Email delivery of PDF reports to one or more recipients
– Works with all Gravity Forms entries past, present and future