What does this plugin do?
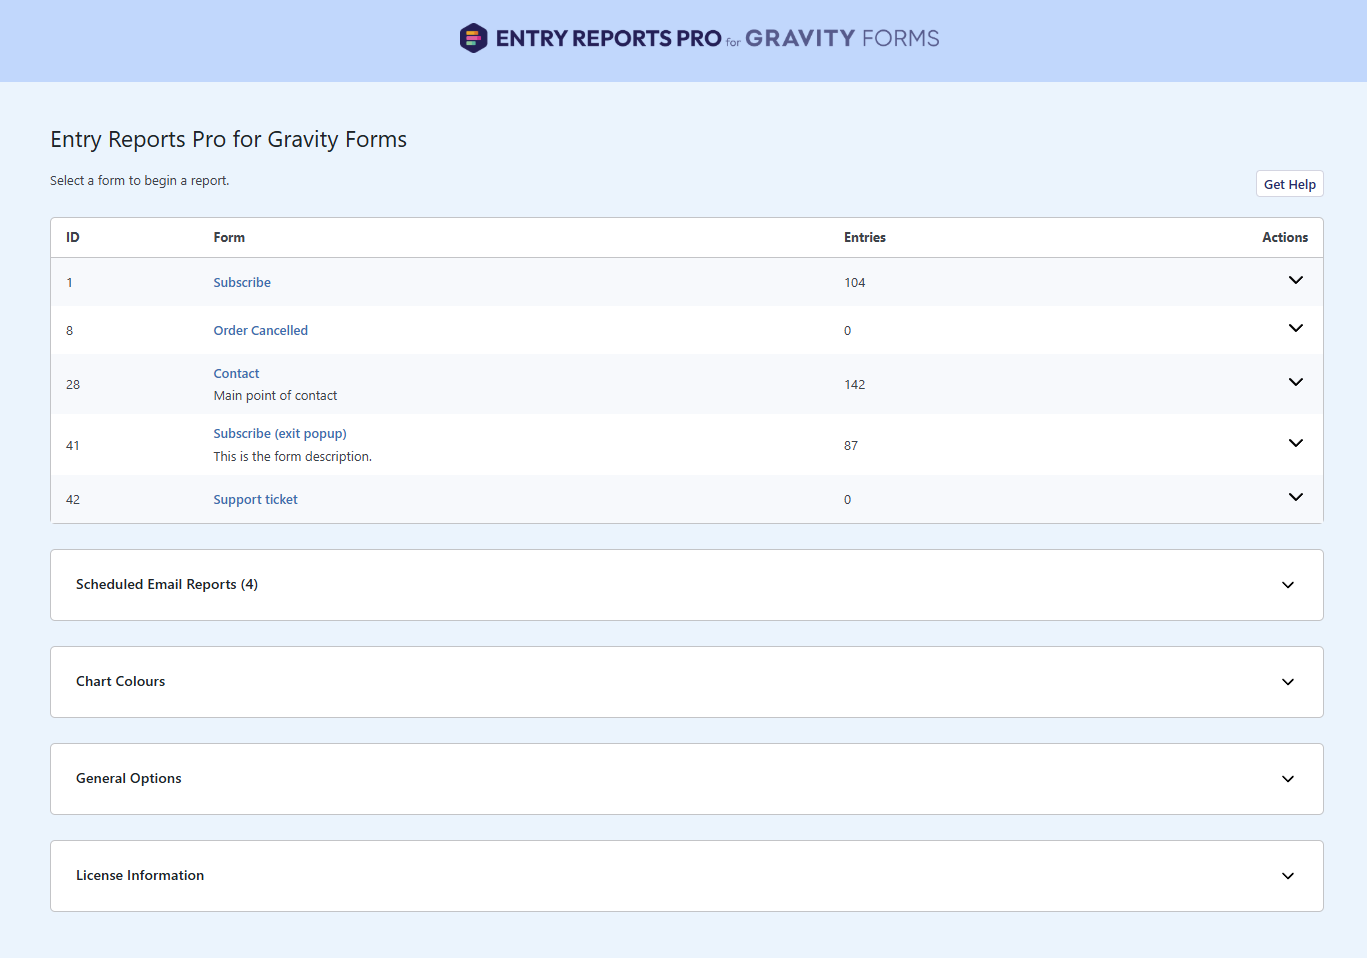
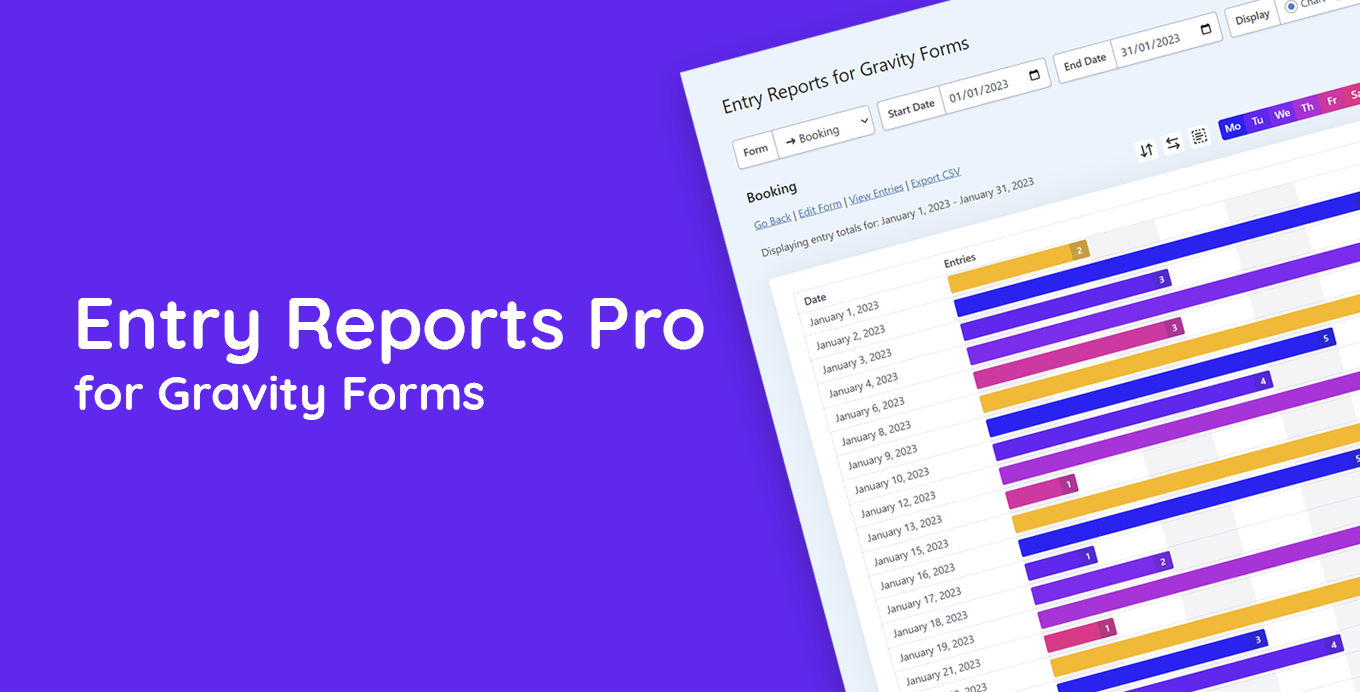
This plugin gives you a clear, visual breakdown of form submissions over time. Just pick a form and set your date range to see exactly how many entries were submitted each day within that period.
When is this useful?
- You’re using a Gravity Form in a marketing campaign and want to track form performance over time
- You want to view entry trends across any specific date range
- You need a quick way to report submission activity to your team or clients
Other features
- Automated Email Reports: Have reports sent straight to your inbox.
- CSV Export: Quickly download a report for further analysis.
- Smart Views & Filters: Focus on just the data you care about.
- View hourly entries: See how many entries were created for each hour of any day.
- View heat map: Show daily submission activity with color-coded intensity to visualise trends over time.
- One-click Downloads: Save charts as images instantly with no fuss.
- Report Presentation: Tweak chart colours or pick from baked-in themes.
- Made for Gravity Forms: Works seamlessly with the forms you already use.
- No Entry Left Behind: Works with past, present and future Gravity Forms entries.
It’s a fast, intuitive way to use Gravity Forms entries for data driven decision making, whether that’s spotting trends, sharing insights, or just keeping tabs on what is and isn’t working.